
Where Riyadh Needs Trees Most
Urban heat and tree canopy equity, computed in the browser
In summer 2025, Riyadh's built-up surface averaged 49.2 °C and only about 5% of it had tree canopy. Ranking every 70 m block by heat risk and access to greenery points to 216 km² where new trees would do the most good, and the whole analysis runs on the visitor's device.
Open the Riyadh Urban Heat dashboard →
Why this question, and why now
Riyadh is one of the hottest large cities in the world. That heat is not shared equally: dense, paved districts with few trees trap far more of it than neighbourhoods along the green Wadi Hanifa corridor.
The city is also in the middle of one of the largest urban greening efforts anywhere. The Green Riyadh Program aims to plant more than 7.5 million trees by 2030 and raise green space from 1.5% to 9% of the city. With that many trees to place, where they go matters as much as how many.
So the dashboard asks one question for every block of the city: how much greenery can residents reach, compared with how much heat they face?
What it found
| Measure (summer 2025, 15 June – 31 August) | Value |
|---|---|
| Mean urban land surface temperature | 49.2 °C |
| Mean daily maximum air temperature (NASA POWER) | 44 °C |
| Urban tree canopy | about 5% |
| Heat hotspots (k-means) | 225 km² |
| Priority planting zones (top 15% by need) | 216 km² |
| Hottest focus district | As-Sulayy (east), 50.4 °C |
| Coolest focus district | Ad-Diriyah, 47.3 °C, over 25% canopy |
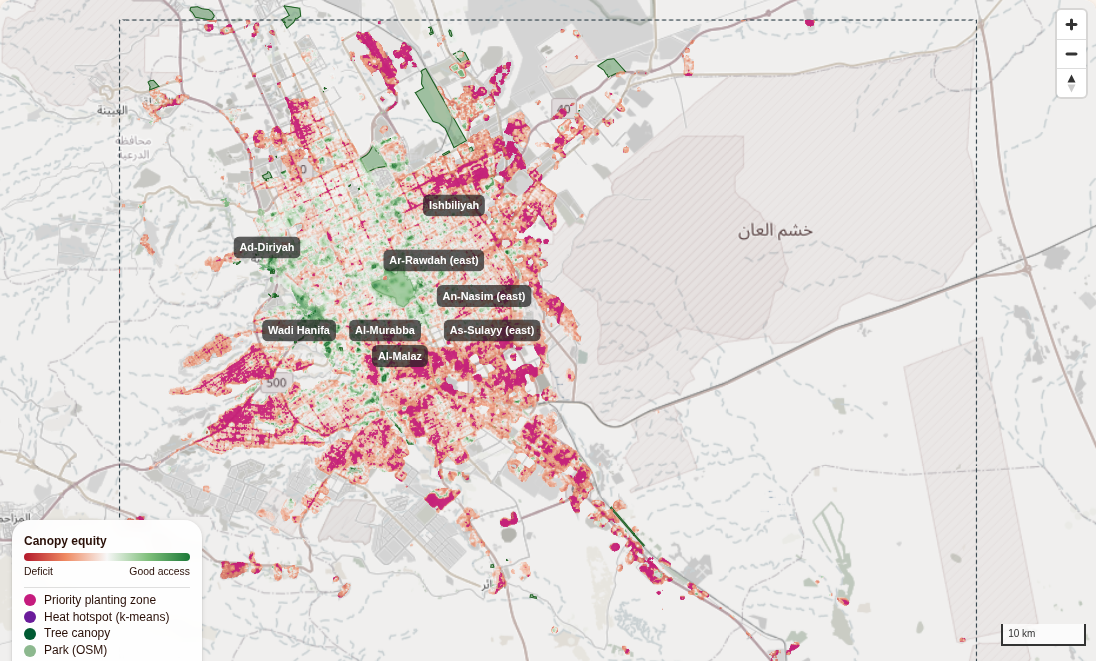
One result surprises people: by day, the city is slightly cooler than the desert around it, by about 0.6 °C. This "urban cool island" is common in arid cities: bare sand and rock heat up faster than irrigated, built-up land. That is why the analysis compares districts within the city, not the city with the desert.
How it works
The site is static files: no VPS, no database, no Python at runtime. Satellite data comes from public APIs, and every calculation runs in the browser.
- Fetch heat, vegetation and land-cover tiles from Microsoft Planetary Computer, trees and parks from OpenStreetMap, and climate from NASA POWER.
- Decode each tile onto a shared 70 m grid of 1.6 million cells.
- Derive canopy, building density, and distances to trees and parks.
- Score heat exposure, vegetation access and equity for every built-up cell.
- Rank cells by risk and lack of access to find priority planting zones.
- Paint the results to a canvas and overlay them on the map.

The stack
| Layer | Library / service | Role |
|---|---|---|
| Framework | Next.js 14, React 18, TypeScript | Static page, state, UI |
| UI | Material UI 5 | Sidebar, sliders, district table |
| Map | MapLibre GL JS 5 via react-map-gl 8 | WebGL map, raster overlays, OSM trees and parks |
| GPU compute | TensorFlow.js 4 (WebGL and CPU backends) | Heat-risk scoring across 1.6 million cells |
| Heat | Landsat 8/9 Collection 2 Level-2, Planetary Computer | Land surface temperature |
| Vegetation | Sentinel-2 L2A, Planetary Computer | NDVI |
| Land cover | ESA WorldCover 2021, Planetary Computer | Built-up, tree cover, urban mask |
| Climate | NASA POWER API | Air temperature, solar radiation |
| Trees and parks | OpenStreetMap via Overpass API | natural=tree, leisure=park |
A 1.6-million-cell grid in the browser
The study area (46.4–47.4° E, 24.3–25.0° N) is analysed on the Web Mercator pixel grid of zoom 11: cells of about 70 m, 1,456 × 1,117 of them.
Using the map-tile grid as the analysis grid is the key design choice. Every tile pixel lands on exactly one cell, no reprojection library is needed, and results drop onto MapLibre as an image overlay that lines up perfectly.
All layers live in typed arrays (Float32Array, Uint8Array): about a dozen layers of 1.6 million values each, well within a browser's memory.
Surface temperature from Landsat
Planetary Computer lets the browser register a STAC search as a mosaic (least-cloudy scenes first, Landsat 8 and 9 only) and request tiles with a band-math expression. Landsat Collection 2 stores surface temperature as scaled integers, so the conversion to °C happens on the tile server:
expression = lwir11*0.00341802+149.0-273.15
rescale    = 10,70
Each pixel arrives as one byte and the browser maps it back to degrees. With a 10–70 °C range over 256 levels, that is a precision of about 0.24 °C, which is finer than the sensor's own accuracy. Decoding uses createImageBitmap with colour conversion and alpha premultiplication switched off, so no value is altered on the way.
Vegetation, land cover and a canopy layer
NDVI comes from Sentinel-2 the same way. One detail matters: from January 2022, Sentinel-2 reflectances carry a +1000 offset, so the expression is (B08-B04)/(B08+B04-2000). Miss it and every NDVI value is biased low.
ESA WorldCover tiles are requested with no colour map, so each pixel is the raw class code (10 = tree cover, 50 = built-up, 60 = bare ground). From it the browser derives building density (share of built-up land within 250 m) and an urban mask.
The tree canopy layer (0–1) takes the strongest of three signals: vegetation density from NDVI, WorldCover tree cover, and mapped OSM trees.
Distances, neighbourhoods and hotspots
- Exact Euclidean distance transforms (Felzenszwalb & Huttenlocher) give every cell its distance to the nearest canopy and the nearest park. Parks are OSM polygons rasterised with a scanline fill.
- Separable box blurs with running sums compute neighbourhood shares, such as canopy within a 300 m walk, in linear time.
- k-means clustering of urban surface temperature (four clusters, quantile-initialised so results repeat exactly) finds the heat hotspots.
Equity and heat risk
For every built-up cell:
- heat exposure = surface temperature relative to the rest of the city (5th–95th percentile);
- vegetation access = the average of neighbourhood canopy, closeness to canopy and closeness to a park;
- equity = access − heat, from −1 (hot and bare) to +1 (cool and green).
A heat-risk index then weighs land surface temperature (w1), building density (w2) and lack of vegetation (w3). The weights are transparent and adjustable with sliders; they are not learned from data. TensorFlow.js runs the scoring as one matrix product (a 1.6-million × 3 feature tensor times a 3 × 1 weight vector) on the GPU through WebGL, falling back to the CPU where needed. It is loaded only on this page, so the rest of the site does not pay for it.
Priority planting zones are the top 15% of built-up cells by risk × (1 − access). My first version used fixed thresholds, and it flagged 60–90% of every district: when almost the whole city is hot and bare, thresholds cannot prioritise. Ranking can, and it is how planners actually allocate a budget.
Limitations
This is a screening tool for planning conversations, not a replacement for field surveys. Read the results with these limits in mind:
- Surface is not air. Landsat measures how hot surfaces are, not the air people breathe. The two are related but not the same.
- One time of day. Landsat passes over Riyadh in the late morning. Afternoon peaks and night-time heat, when the urban heat island is usually strongest, are not captured.
- Resolution. Landsat's thermal sensor is 100 m native. The 70 m grid does not add detail; it matches the map tiles.
- A composite, not an average. The mosaic takes the least-cloudy scenes, so it shows typical clear-sky summer conditions, not a seasonal mean.
- Land cover is from 2021. Planting under Green Riyadh since 2022 is only partly visible, through Sentinel-2 NDVI.
- Mapped trees are not all trees. OSM has only 874 mapped trees in the whole area, so distances use all canopy, not just OSM points.
- People are not yet counted. Equity is measured per block of land, not per resident.
What I learned
- Satellite analytics no longer need a server. Keyless tiles plus server-side band math deliver analysis-ready values straight to the browser.
- The tile grid is a free analysis grid. Typed arrays handle millions of cells without a GIS library.
- TensorFlow.js is a practical GPU compute engine for raster work, not only for neural networks.
- Rank, don't threshold, when the whole area is at risk.
What's next
- Weight by population. Add WorldPop so priority zones favour blocks where more people live.
- Learn instead of assume. Train a small model that predicts surface temperature from canopy, building density and distance to parks, validated on held-out districts. The dashboard could then answer the planner's real question: how much cooler would this block be with 10% more canopy?
- Track Green Riyadh over time. Repeat the analysis each summer to see whether new planting reaches the hottest blocks.
If you work on urban greening, heat resilience or Green Riyadh projects and want to explore the data for your district, get in touch at [email protected].
Open the Riyadh Urban Heat dashboard →
Data: Landsat 8/9 and Sentinel-2 (USGS, ESA Copernicus) via Microsoft Planetary Computer; ESA WorldCover 2021; NASA POWER; © OpenStreetMap contributors. Green Riyadh targets from the Royal Commission for Riyadh City.