CoffeeMap.dev
HomeAboutExpertiseContactالعربية
Back to Home

Web Mapping

Interactive web mapping platforms using Leaflet, Mapbox, and Cesium for immersive data visualization.
Leaflet
Mapbox
Cesium
Three.js
D3.js
React

Projects

Sudan Conflicts
Web Mapping
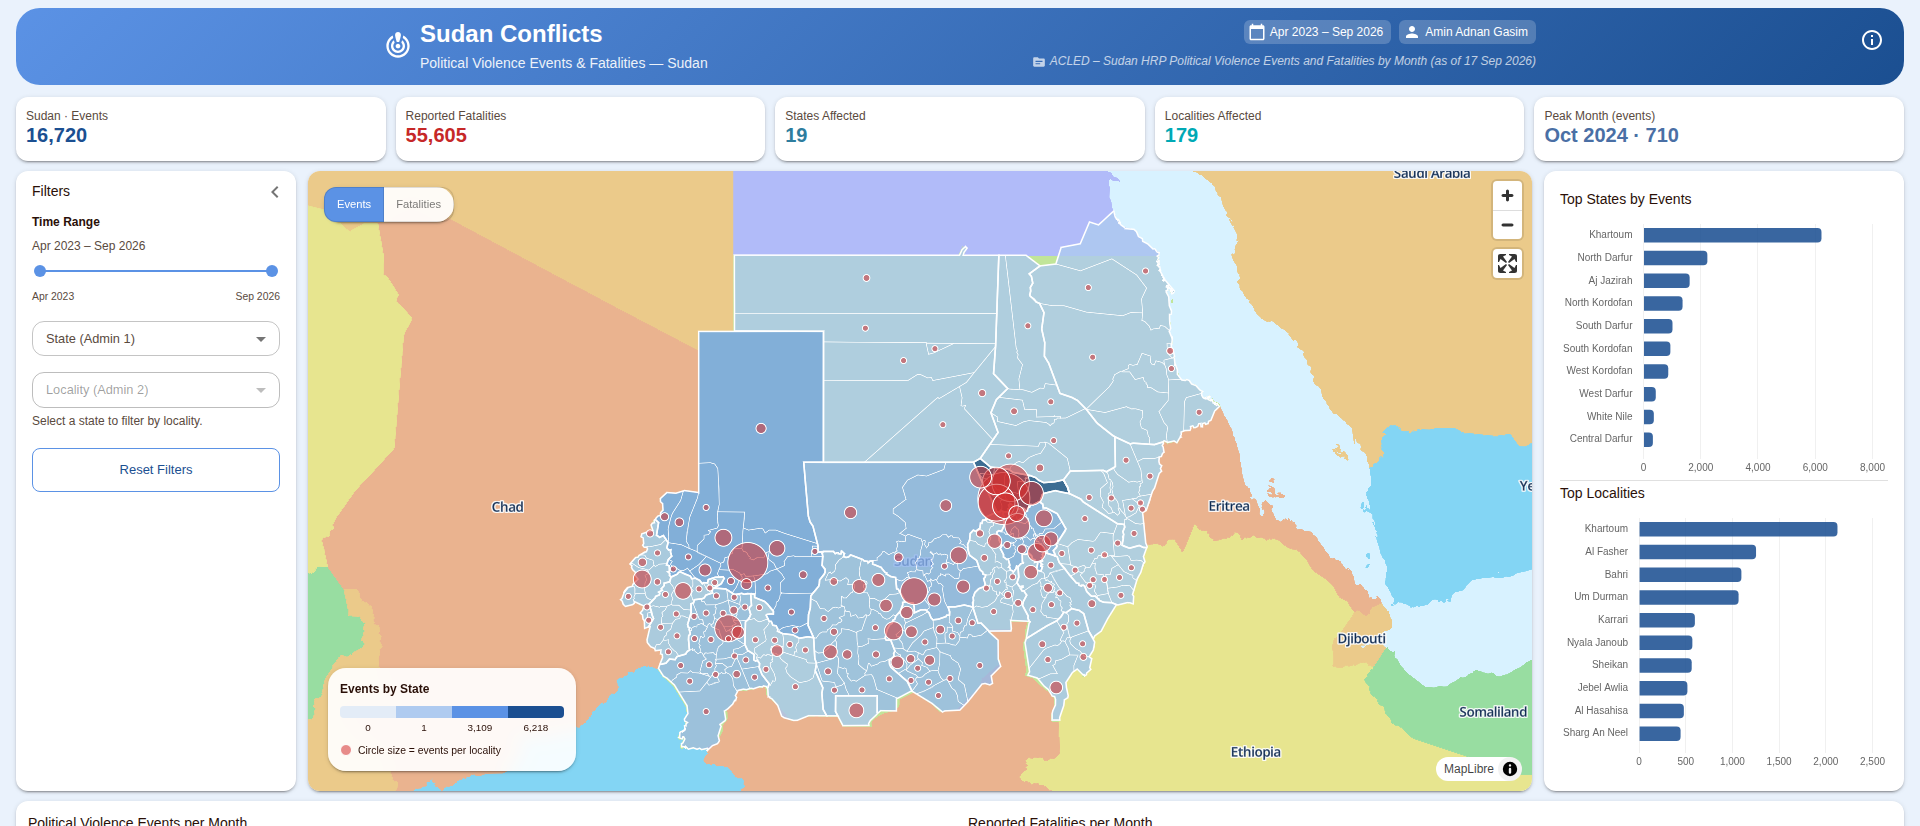
Sudan Conflicts

Conflict monitoring dashboard mapping ACLED political violence events and fatalities across Sudan since April 2023, by state, locality and month.

Next.js
TypeScript
MapLibre GL JS
Chart.js
Material UI
Node.js
GeoJSON
ACLED Data
View Demo
Sudan Flood Dashboard
Web Mapping
Sudan Flood Dashboard

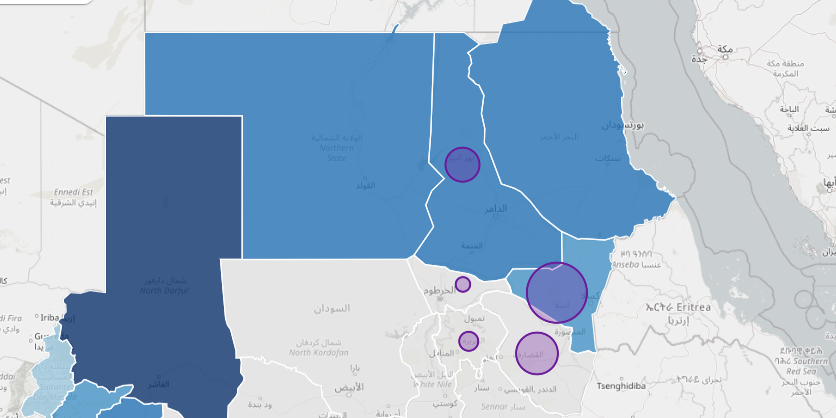
Interactive humanitarian dashboard tracking flood crisis, displacement, and disease outbreaks across Sudan states using real OCHA data.

Next.js
TypeScript
MapLibre GL JS
Chart.js
Material UI
GeoJSON
OCHA Data
View Demo
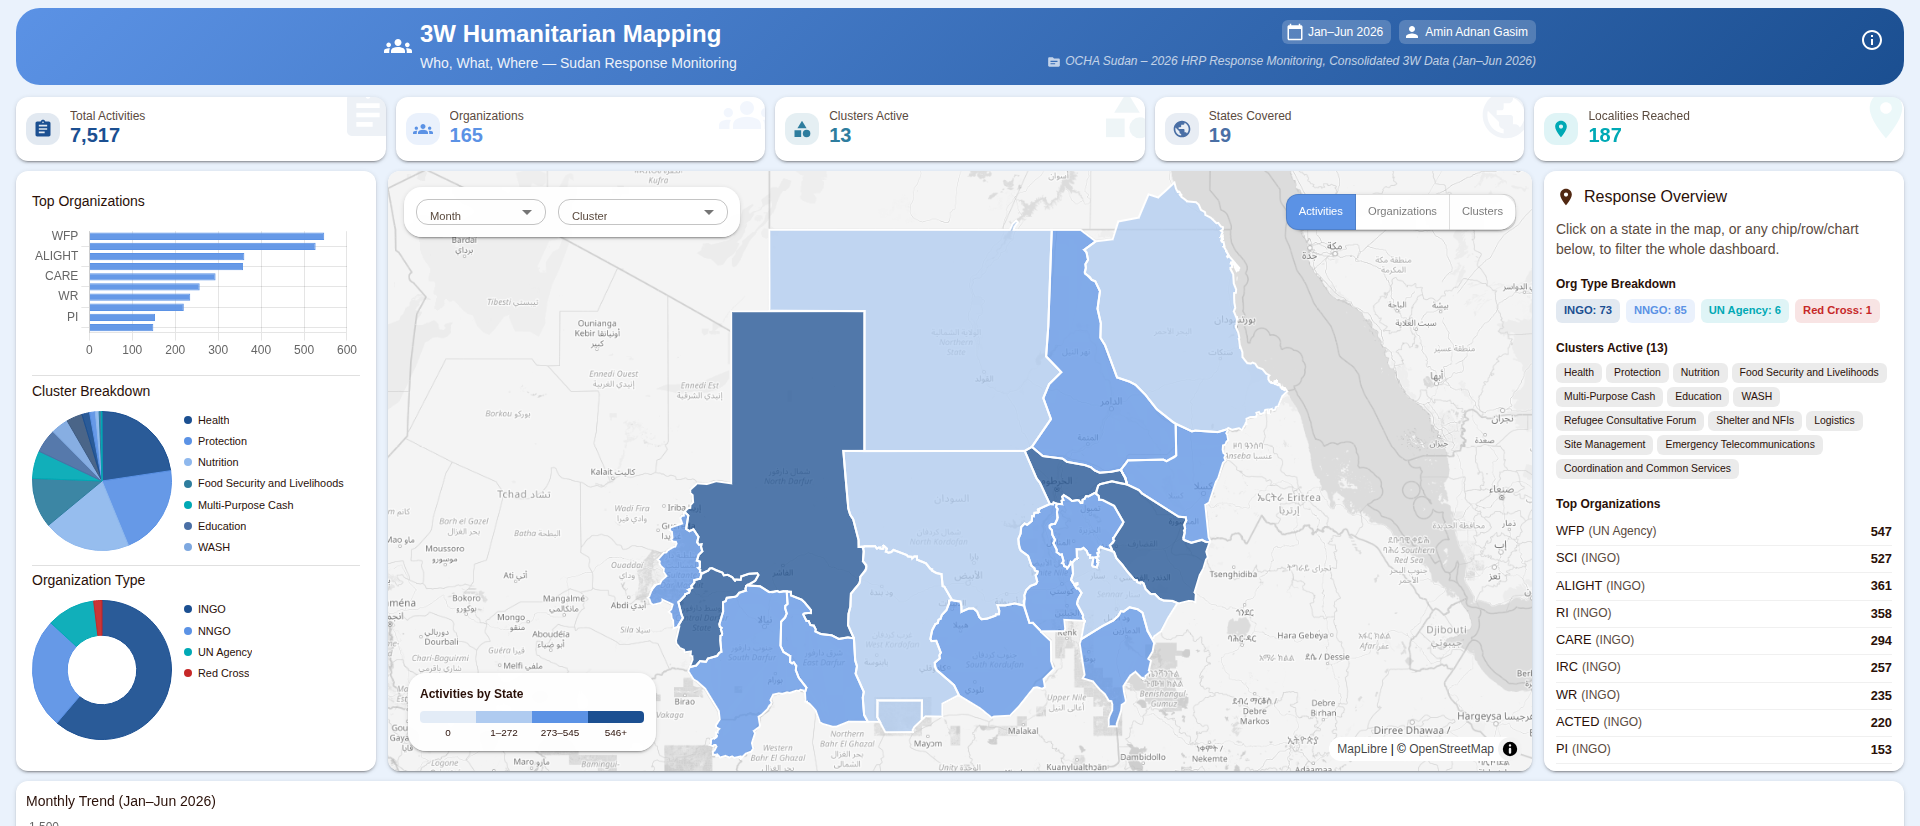
3W Humanitarian Mapping
Web Mapping
3W Humanitarian Mapping

Who What Where dashboard tracking Sudan humanitarian activities, active partners, and coverage gaps using real OCHA 3W response monitoring data.

Next.js
TypeScript
MapLibre GL JS
Chart.js
Material UI
Node.js
GeoJSON
OCHA 3W Data
View Demo
CoffeeMap.dev

Brewing Data into Actionable Geospatial Insights

Created by Amin Adnan Gasim

© 2026 CoffeeMap.dev. All rights reserved.